
Often when our clients try to analyze their HR with Excel or another traditional analytics tool, they find the process complex, confusing and frustrating.
Today, we will show you how to build and retain the best possible workforce and increase your business performance through Business Intelligence for your Human Resources.
This article is a practical guide straight to the point to show you exactly how to boost Your recruitments through BI.
What does BI mean for Human Resources?
As detailed in our previous article “Business Intelligence” What exactly is it? – The term Business Intelligence (BI) refers to the technologies, applications, and practices for collecting, integrating, analyzing, and presenting information to help you make better decisions.
As a recruiter or HR manager, you use HR BI to make informed data-driven hiring or people management decisions.
While human resource analysis is important for both hiring and people management, in this article, we will focus on recruiting, also known as Data-Driven Recruitment.
Why is this important for your business?
A recent report from Deloitte found that organizations that used people analytics correctly reported 82% higher three-year average profits than those that don’t yet use or don’t use data analytics strategies correctly!
When data is applied to recruitment, HR Business Intelligence can help you:
⦁ Save money.
⦁ Reduce wasted time.
⦁ Hire the right skills.
How to implement BI in your HR strategy
Now that you understand what it is and why it matters, let’s take a step-by-step look at how you can implement BI.
⦁ Track your recruitment data
This can be done through an Applicant tracking system (ATS) which is software that enables the electronic processing of recruiting and hiring needs.
ATS can be implemented or accessed online at the enterprise or small business level, depending on the needs of the organization; free open-source set TTYs is also available as Opencart or Smart Recruiters.
You can find a built-in (or integrable) ATS in most modern HRIS and ERPs like SAP, Oodoo, or Novoreka.
⦁ Analyze your data via an Agile BI System
If you combine your ATS (or ERP) with a tool that can effectively present this data like Power BI, a free Agile BI tool, you can track dozens of key figures!
From our experience, the 3 most important metrics to follow in recruiting are:
⦁ Time To hire
Did you know that the average time for the best candidates to find and be accepted for a job is 10 days?
To get the best talent you will need to hire faster and that starts with understanding your time to hire or TTH (Time To Hire).
The time to hire represents the time during which a candidate expresses his interest in your position when he accepts your offer.
Each vacancy has a different TTH, but when you track this metric, you can find the pain points in the recruiting funnel.
This can lead to the loss of very good candidates due to long recruiting times. Once you know this, you can start making improvements to your recruiting process.

How to do this?
To reduce this time, you must first determine the average time to hire.
If your ERP or ATS system has a reporting function, this is a fairly easy number to find. Otherwise, you can use an Agile BI tool like Power BI to calculate it quickly.
And you can usually break it down by specific position, departments, recruiters, or even the referring platform (employer for example)
If your ERP or ATS cannot follow this you can follow it manually too!
- Find the sum of the time that recruitment took for each position, for example, the sum for the time of all recruitments of delivery people is 304 Days
- Divide it by the number of recruitments in this position, for example, we recruited 90 delivery men, and therefore our result is: 304/90 = 3.37
- The result is your TTH, calculate this monthly to measure the effectiveness of your efforts to improve TTH.
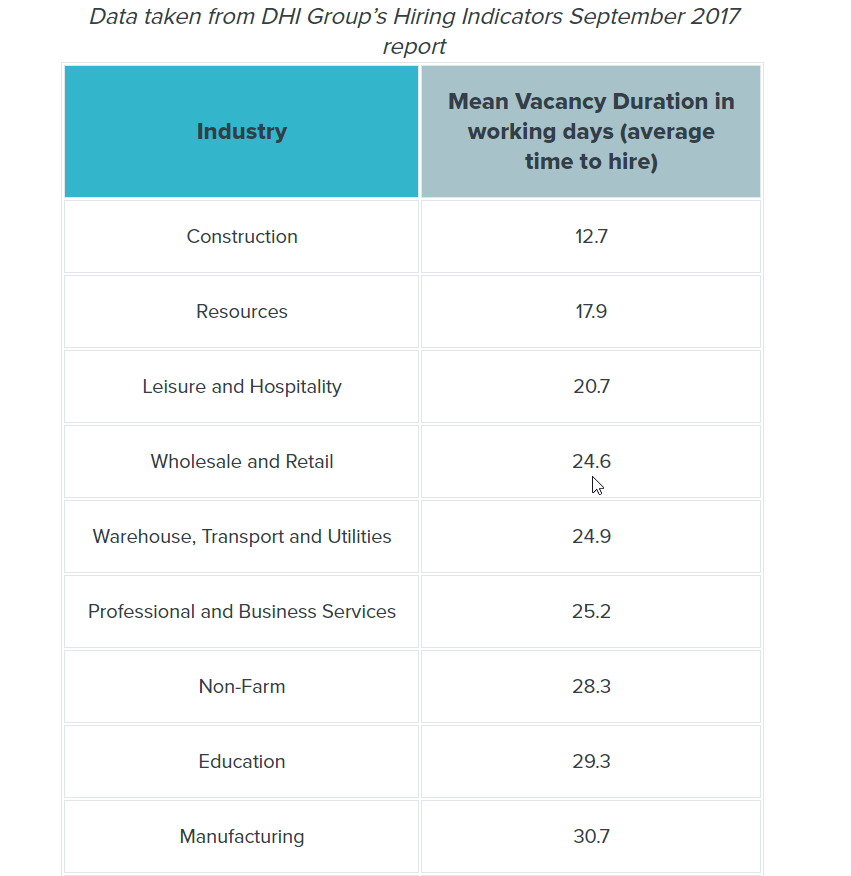
If you want to know how your recruiting time compares to that of other companies, Workable has a great reference tool that can provide you with data on recruiting time, categorized by industry and location.
Remember, this tool will not give you all the information, but will let you know if you are on the right track.
You can take this analysis even further, it’s about understanding which part of the hiring funnel takes the most time.
Is it about the CV selection time? Does your hiring manager take forever to give you information about a candidate? You can then set up tools to optimize your time to help you.

To do this, you have to invest a little time to master agile BI via Power BI or Excel you will then do the same process to calculate the duration of each step of your recruitment process.
You can do this by taking our Power BI Zero to hero Beginners course or just downloading Power BI for free and trying to make it work for yourself
This will allow you to answer the above questions and know where to take action to reduce Total TTH.
From our experience this information and these tools allow you to reduce your average time to hire by around 5 days, this means that your team will have a new member 5 days earlier than they would if you were not doing this at all to increase their productivity and that recruiters can focus on ‘other more productive tasks for them. It makes a huge difference!
⦁ Sourcing Intelligence
There is a lot of talent competition today, and there are times when high-quality candidates don’t apply to your job posting, so recruiters need to use digital sourcing to try to efficiently find candidates. Fortunately, recruiters have many ways to reach candidates, such as job boards like Emplotic or Emploipartner, social networks like LinkedIn, and others.
There are many different analyzes you can look at when it comes to sourcing.
However, there’s no point watching these reviews if you don’t even know which channel is bringing you the best quality applicants.
So let us give you an example: If your data shows that a large number of your long-term employees come from a certain job posting site, you may devote more time and energy to that site when you recruit again for that position. The same is true when you have low-quality candidates or low-performing employees who come from another ad site. You can then spend less time and energy on it.
Small note: If you have a low-performing employee who comes from a job posting site, that is not enough to prove that the low-quality candidates come specifically from that site.
Knowing this data helps recruiting teams save time and save money.
A few companies use an ATS which establishes unique candidate links for each job posting board, sourcing search, referral, etc. It then tells them where they found that person or from which job site they applied.
The ATSs that offer this feature are generally quite expensive and may exceed the allotted budget.
We recommend instead keeping track of it using Google Analytics and UTM settings.
A UTM code is a string of text that you can add to the end of URLs that you use in your job descriptions, announcements, social posts, etc.

A UTM link will replace the link in your ad to tell Google Analytics where the candidate came from. In practice, if the link of your form is:
www.yourcompany.com/candidature
It becomes: www.yourcompany.com/candidature?utm_source=facebook&utm_medium=social&utm_campaign=livreur
This link tells google analytics that this candidate is from a campaign to find delivery people from a social network which is Facebook.
UTM.io is a great tool that builds UTM links for you, you just need to add your site to your Google Analytics account.
⦁ Funnel efficiency
Before you go any further and analyze this Indicator, find a good place to track this data so that you can visualize it. Power BI is our recommendation as it can consolidate data from multiple sources at once, and it’s free.
So that brings us to our third measure, which is the effectiveness of the hiring funnel.
Now let’s see why quality candidates don’t apply for your job. The hiring process puts candidates through a funnel that most people believe begins with procurement and ends with a contract. However, some recruiters, Dash included, believe the funnel begins with employer branding.

Your brand as an employer is all that makes you different and stand out as a dream employer to your potential candidates.
If we can talk about each stage of the funnel, let’s show the important measure of the number of visitors to your website requester conversion rate, which is from the top of the funnel.
According to Jobvite, if your conversion is above 11%, you have an exceptional employer brand and web recruiting portal. If you are below 11%, you can probably do more to have more impact on your potential candidates.
Once again, Google Analytics comes to the rescue. Google Analytics tracks visitors to your website. It also tells you where they came from, how they use your website, and what other pages they visit like your team page and a lot of other useful information. It’s free and quick to set up.
If you need step-by-step support in setting up Google Analytics on your site in combination with Power BI so that you can continue your investigation, hire us as partners, we will be happy to help you.

You may find that people are not staying on your careers page, there are a lot of ways that you can implement to optimize it.
Don’t know where to start? ask your potential candidates via a pop-up on your website what they want to see on your careers page.
You can also ask your candidates who applied what they liked about your careers page and what they felt they were missing during the interview. You should focus on employer branding and technologies to create a truly great experience for your candidates.
A few things seem to work in general, like being authentic when promoting your business and using employee stories to explain your business values. Others like to apply via their cell phone, so make sure your career website has a very smooth mobile experience.
So you act on the information you discover through your data and use the power of data to increase productivity, efficiency, and profit.
To conclude
Sometimes HR analysis can give an overwhelming impression, but it doesn’t have to be.
Start with what you believe to be your main indicators then collect the necessary data, the return on investment on these will allow you to move towards more advanced approaches to HR data analysis such as machine learning and predictive analytics in general, but it has to be done on a good foundation.
If you like the idea and are having difficulty implementing it, Dash-BI is there for you, Hire us!